
As a business consultant who often goes directly into the field—or as it's popularly known, 'blusukan'—I often encounter phenomena that are quite heartbreaking. Some time ago, I sat down to discuss with the owner of "Culinary Business Y", a very popular restaurant in South Jakarta. On the surface, their business is extraordinarily successful. The line of online motorcycle taxis stretches to the side of the road, the dining tables are always full, and the sound of the cash register hardly stops from morning until night.
However, the owner, with a tired face and vacant stare, whispered to me: "Mr. Firman, my revenue is in the billions, but why is my cash flow always tight? I feel like my business is leaking everywhere, but I don't know where the holes are."
This is what I call The Illusion of High Revenue. Many SMEs in Indonesia still lead their businesses only with traditional "instinct" or "feeling". They feel satisfied just by looking at daily sales figures without realizing that behind the hustle and bustle, there are systematic inefficiencies that slowly erode profit margins. The contradiction between subjective "business instinct" and objective precision of Business Intelligence (BI) often becomes the dividing line between businesses that merely 'survive' and those that truly 'expand'.
Our mission at Matasigma is very specific: we want to eliminate the rusted stigma in the minds of our entrepreneurs that modern data technology is only for conglomerate companies or multinational corporations. The reality is, in an era of global competition that penetrates local markets, SMEs actually need BI more to survive. Gambling on intuition alone without accurate data support is a sure recipe for failure in the future.
"At Matasigma, we believe that financial accountability is not just a report for tax purposes, but the key to sustainable growth. Without reliable data, you are not leading a business; you are navigating a ship in the middle of a storm without a compass." — Firman Siahaan.
Data + Analysis = Knowledge — Matasigma's Secret Formula for SMEs
Often, SME players feel overwhelmed when they hear the term Business Intelligence. In fact, fundamentally, BI is the process of transforming raw data into meaningful information to support decision-making. We at Matasigma simplify it into an elegant mathematical formula that forms the foundation of our work: Data + Analysis = Knowledge.
Let’s break down its components based on technical facts:
Data: This is the raw material. It usually comes from your daily transaction systems, such as ERP (Enterprise Resource Planning) or POS (Point of Sales) systems. Its content is raw records of orders, deliveries, invoices, to stock lists. However, this raw data is "silent". It has no life if not processed.
Analysis: This is an interactive process where we "interact" with the data. In the world of BI, we use techniques such as drilling (digging into data from a macro level like national sales totals to a micro level like hourly sales at a single store), pivoting (rotating data dimensions to see new perspectives), and filtering (sifting through relevant data for specific cases).
Knowledge: Here is the final result. This knowledge allows companies to understand past performance, discover unexpected correlations, and make future predictions (forecasting).
However, knowledge does not stop at the numbers on the screen. Matasigma applies a Analytics Life Cycle that is systematic: Analyze -> Plan -> Act -> Check. Knowledge generates analysis, analysis gives birth to action plans, those plans are executed, and the results are checked back through data. This cycle ensures continuous improvement (continuous improvement).
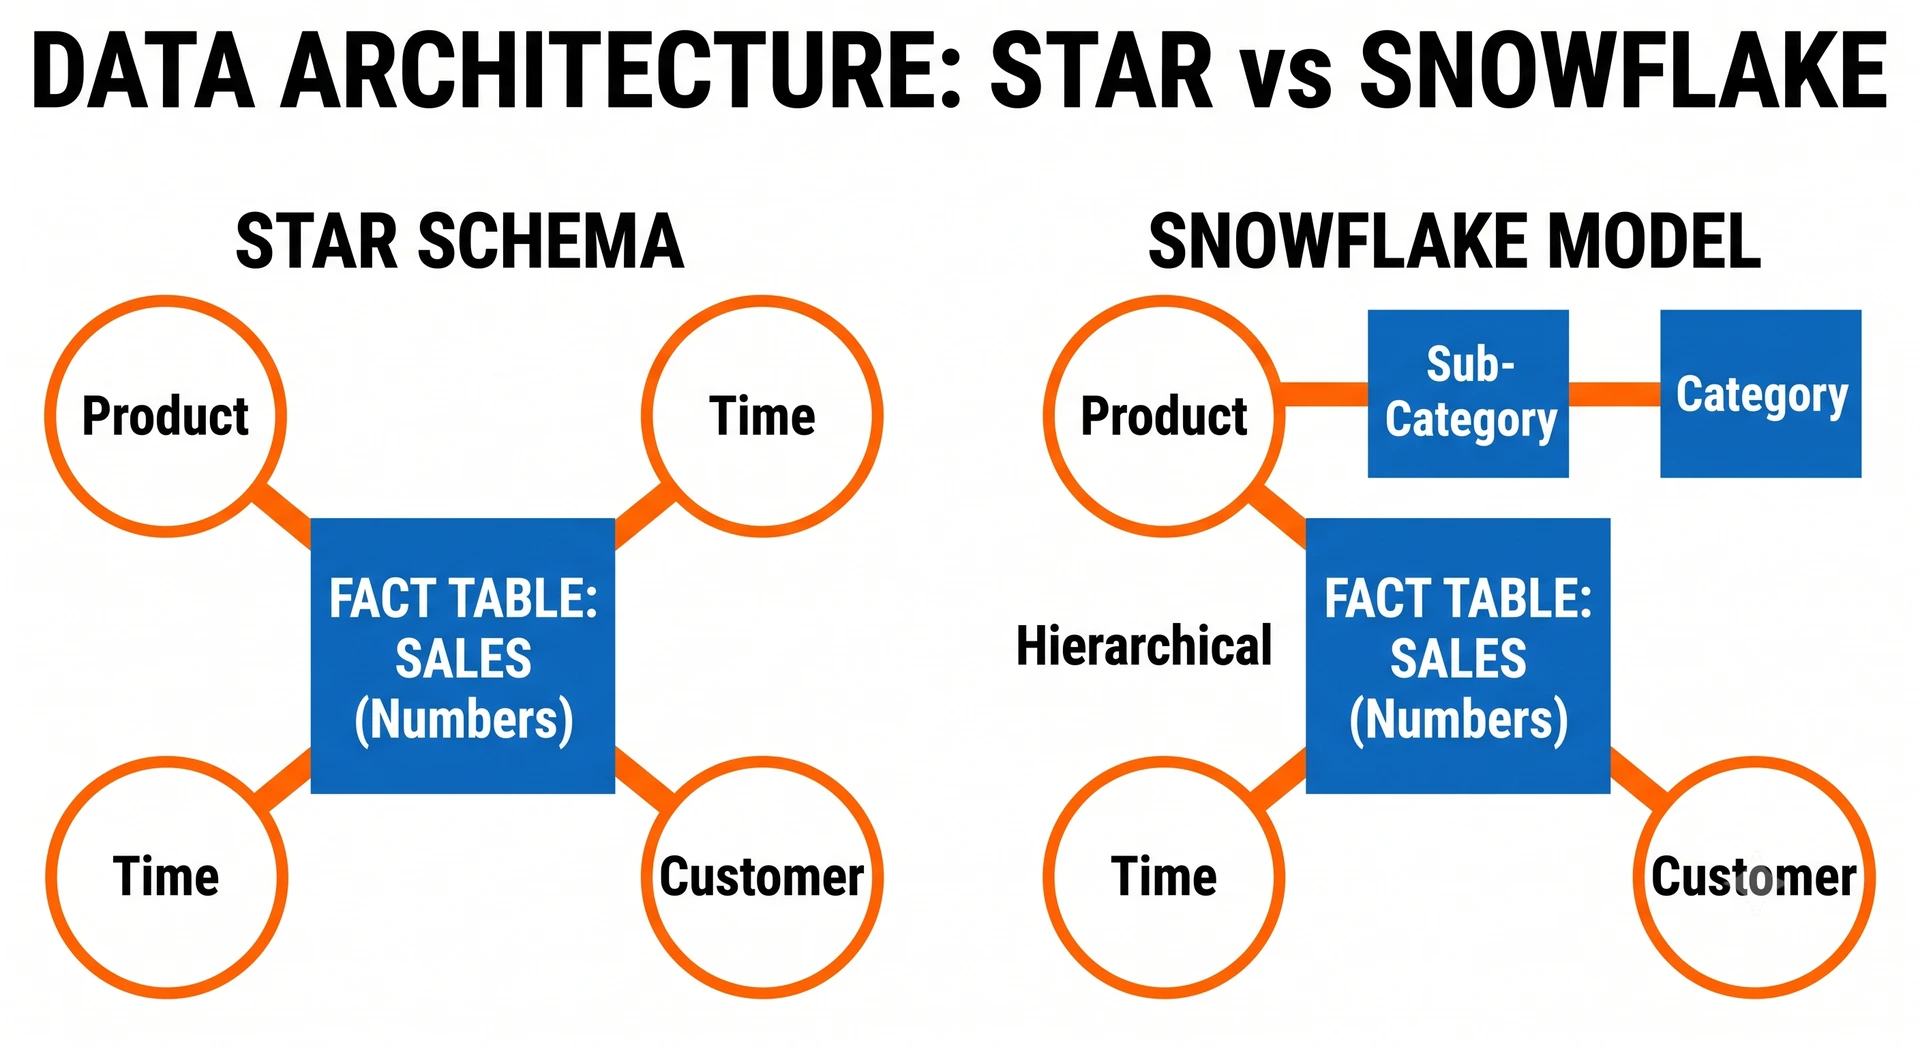
To realize this, the data architecture must be solid We introduce the concept of Star Schema and Snowflake Model as the "blueprint" for your data warehouse. Star Schema places the fact table (such as sales figures) at the center, surrounded by simple dimension tables (such as products, time, and customers). Meanwhile, the Snowflake Model is more complex with multi-level hierarchies (for example: Product -> Category -> Sub-Category). Choosing the right model is key to ensuring that the BI system is not slow and remains accurate.
Imagine "Retail SME A" that previously kept manual stock records in Excel. One day, there was a accounting mismatch due to one missing line of data. In a manual system, finding one mistake among thousands of lines is a nightmare. With the precision of the BI system, each line is processed through the ETL path (Extract, Transform, and Load) tight, ensuring data integrity remains 100% intact
From Strategic to Tactical — Bringing the Power of Data to the "Shop Floor"
Historically, BI has been known as an elite tool. We used to know it as EIS (Executive Information System) or DSS (Decisional Support System). As the name suggests, this tool was only available on the computers of directors to determine the long-term direction of the company or Strategic BI.
However, times have changed. Matasigma is driving a paradigm shift towards Tactical BI. This is a form of data democratization, where the power of insights does not just stop in the boardroom, but extends down to the "shop floor" or warehouse to assist in fast daily operations.
Let’s look at a concrete example of Tactical BI in the field:
Warehouse Operator: Instead of waiting for weekly reports, a warehouse operator uses a dashboard to monitor stock levels in real-time. When he sees that the stock of a particular bolt is running low, he can immediately perform a refill without having to wait for manager instructions. This prevents production or assembly line stoppages that could incur significant costs.
Retail Store Staff: Imagine a clothing store staff member who looks at their tablet and finds that the color "Sage Green" is trending in searches and purchases over the last 48 hours. Tactically, they can immediately change the clothes on the mannequin in front of the store to that color to attract more visitors right away.
This is the essence of Tactical BI: giving control to those on the front lines to take immediate action based on facts, not just orders from superiors that may be outdated.
Three Pillars of BI Success — Foundations That Cannot Be Compromised
In building BI solutions at Matasigma, we never compromise on the three main pillars: Reliability, Availability, and User Experience.
Pillar 1: Reliability and "0.09% Factor"
Data in BI must be 100% consistent with its source systems. Why? Let's use a real case. Many entrepreneurs overlook small discrepancies in their data. However, ignoring a 0.09% discrepancy in total gross sales (Gross Sales) can have fatal consequences. Why? Because that 0.09% difference may hide very high management costs for return orders (return orders). If these return costs are not tracked, your Net Revenue (Net Revenue) analysis will be completely flawed.
Another extreme case: A manufacturing CEO sees a drastically declining chocolate sales report and decides to fire the Brand Manager of that chocolate. It later emerged that there was a technical error in the product catalog in the BI system— the product was actually selling well, but its sales were not recorded due to an internal code change. The firing was a business tragedy caused by unreliable data.
Pillar 2: Availability
Accurate data is useless if it arrives too late. This pillar ensures the system is stable and data is updated according to consumer needs, whether daily or even intraday refresh (multiple times a day). If a car assembly operator needs stock data on Friday night at 8, but the system is under maintenance or the data hasn't been updated since Wednesday, then they are forced to "guess." The result? Production could come to a complete halt on Monday morning due to a shortage of small components.
Pillar 3: User Experience (UX)
Technology must adapt to humans, not the other way around. UX in BI means the tool must be tailored to the capacity of local users. An expert analyst may need advanced features to process data, but commercial staff or small business owners do not need (and should not be forced to) write coding complex SQL. The interface should be intuitive, visual, and allow for quick navigation to business conclusions.
Fishing in the "Data Lake" — The Agility of SMEs Amidst the Flood of Big Data
We are now in the era of Big Data—an extraordinarily large volume of information generated every second from social media, GPS, to application mobile. The traditional Data Warehouse (DWH) approach is often too slow and expensive to process this unstructured data.
This is where we introduce the concept of Data Lake. Imagine a "data lake" where all raw information is collected. Unlike DWH that demands strict rules and complicated ETL processes upfront to ensure 100% homogeneity, Data Lake allows us to directly "fish" (fishing) for the specific information we need.
The advantages of Data Lake for SME agility:
Unlimited Flexibility: We can directly explore raw data without being hindered by the rigid rules of DWH.
Fuel for IoT (Internet of Things): Data Lake is the best place to store data from smart devices. For example, a modern SME café could use data from a smart fridge (smart fridge) to automatically monitor milk temperature or a cleaning robot that sends reports on which areas are the dirtiest to optimize customer table placement.
Tolerance for Data Loss: In DWH accounting reports, losing a single row of data is a disaster (mismatch). However, in Big Data analysis (for example, analyzing comment trends on social media), losing one comment among a billion users is tolerable as long as the larger trend is captured.
For SMEs, Data Lake provides the ability to "see" customer behavior from modern sources without having to build a very expensive relational database infrastructure upfront.
Agile and Open Source Implementation — Modern BI Without Going Bankrupt
The biggest fear of small business owners is cost. Many back off regularly when they hear about the costs of corporate BI software licenses. At Matasigma, we break through this barrier with a strategy Open Source and methodology Agile.
Open Source Technology
We leverage reliable Open Source software:
Database: Using MariaDB as a strong storage core.
ETL: Using Pentaho Data Integration (PDI) or Kettle to process and transform data efficiently.
Reporting: Utilizing user-friendly interfaces like Power BI or Microstrategy Desktop. This way, your capital is redirected from paying expensive licenses to developing data quality and analysis that truly adds value.
Agile Methodology (Scrumban)
Building BI is not like building a building that must be 100% complete before it can be inhabited. We use an Agile, specifically Scrumban—a combination of Scrum structure and Kanban flexibility. This approach is very effective for BI because data often changes and has uncertain variables.
Sprint 0: We start with a deep initial analysis phase to map data sources and key business needs. This is the foundation before construction begins.
Product Backlog Items (PBI): All user needs are broken down into small units called PBI. Each unit must have a clear business value.
Definition of Done (DoD): This is our quality checklist. A feature is not considered "done" if it has not passed performance tests, user validation, and technical documentation. This ensures that SMEs do not pay for half-finished or non-functional features.
This methodology guarantees the existence of Single Version of Truth (SVOT)—one data truth for all departments—that can be achieved gradually in a matter of weeks, not years.
The Future of Transparency — The Coretax Era and Data Literacy in Indonesia
The business world in Indonesia is transforming towards full transparency. The emergence of the Coretax system by the Directorate General of Taxes is not just about tax collection, but about the digitization of Indonesia's business record. In this era, data literacy (data literacy) is no longer an option, but a matter of life and death for your business.
BI plays a vital role as a "shield" for SMEs. With precise data recording, you not only simplify tax compliance but also have strong financial accountability when facing auditors, banks for credit applications, or potential investors. Data visualization helps you detect "leaks" in margins before they become big holes that sink your business ship.
In an increasingly competitive market, where global retail networks are starting to enter remote areas, data literacy is the only way for local SMEs to fight back. Those who can read data will always be one step ahead in understanding customer desires compared to those who only rely on intuition that is starting to dull.
Looking to the Future with Sigma Eyes
The journey to transform into a data-driven company (data-driven) is indeed challenging, but very valuable. We have seen how Business Intelligence can turn mysterious "leaks" into real profit opportunities through a simple formula Data+Analysis=Knowledge.
My message as a consultant: Don't wait for your business to become a giant to start using BI. Instead, use BI so that your business can grow into a giant with a strong foundation. Having reliable data, available on time, and easy to use is the best investment you can make for your business today.
Before I conclude this writing, I would like to leave you with one reflective question to ponder while evaluating this month's sales report:
"Are you leading your business based on the facts that are clearly visible before your eyes, or are you actually just chasing a shadow of illusory revenue?"
Let's start looking sharper. Let's start seeing with Sigma Eyes.
By: Firman Siahaan, Senior Business Consultant & Co-Founder of Matasigma.com.